
Having discovered that the entire image archive has moved I am now excited to expand on my previous iteration and update my workflow to accommodate the much improved naming conventions.
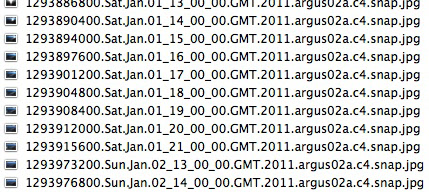
fig.1: A sample of the new file naming convention. The first 10 digit chunk of the file is the epoch time of the image sample.
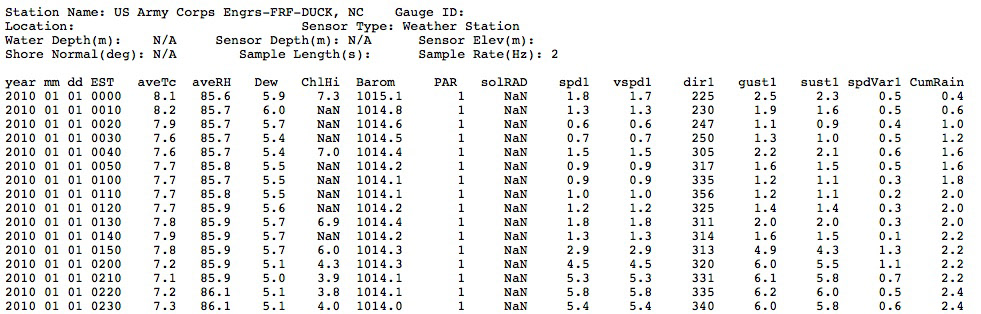
fig. 2: A sample of data weather data. Notice the Year/Month/Day/Time structure of each line.
I've decided to take advantage of the epoch time standard included in the new file names (fig.1), but I will still have to convert the epoch time into a format that i can sync the weather data against (fig. 2). This may seem like an extra step initially, but I think it's going to make things smoother in the long run. Below (fig. 3) is a max patch utilizing a javascript object to convert the epoch time to human readable time and then a second javascript object to convert the month name to an integer. Finally the result is re-organized to match the Year/Month/Day/Time format of the data.

fig. 3: Max patch converting epoch time to human readable time in order to match the data format.
After a lot of steps, which I won't bore you with here, I've successfully combined all my data into one file which will control the audio and draw the data graphs (fig. 4).
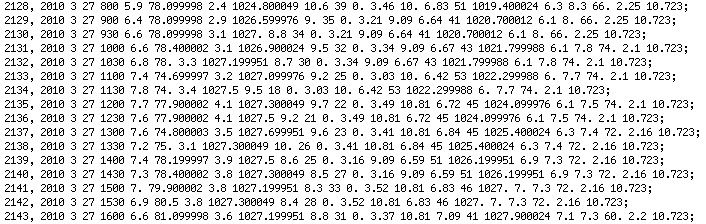
fig. 4 All of the data combined into one text file to be used to control the audio and draw graphs.
And finally, my main Max patch can be seen below (fig. 5). Bangs are sent via the qmetro object. Each bang triggers a new frame and also causes the corresponding line of data to be output. That data is used to drive different sounds, and is also used to draw the graph using a jit.gl.sketch object. The data being utilized for this version is wave height, swell direction, swell period, wind speed, wind direction, cumulative rain, air temperature, and water temperature.
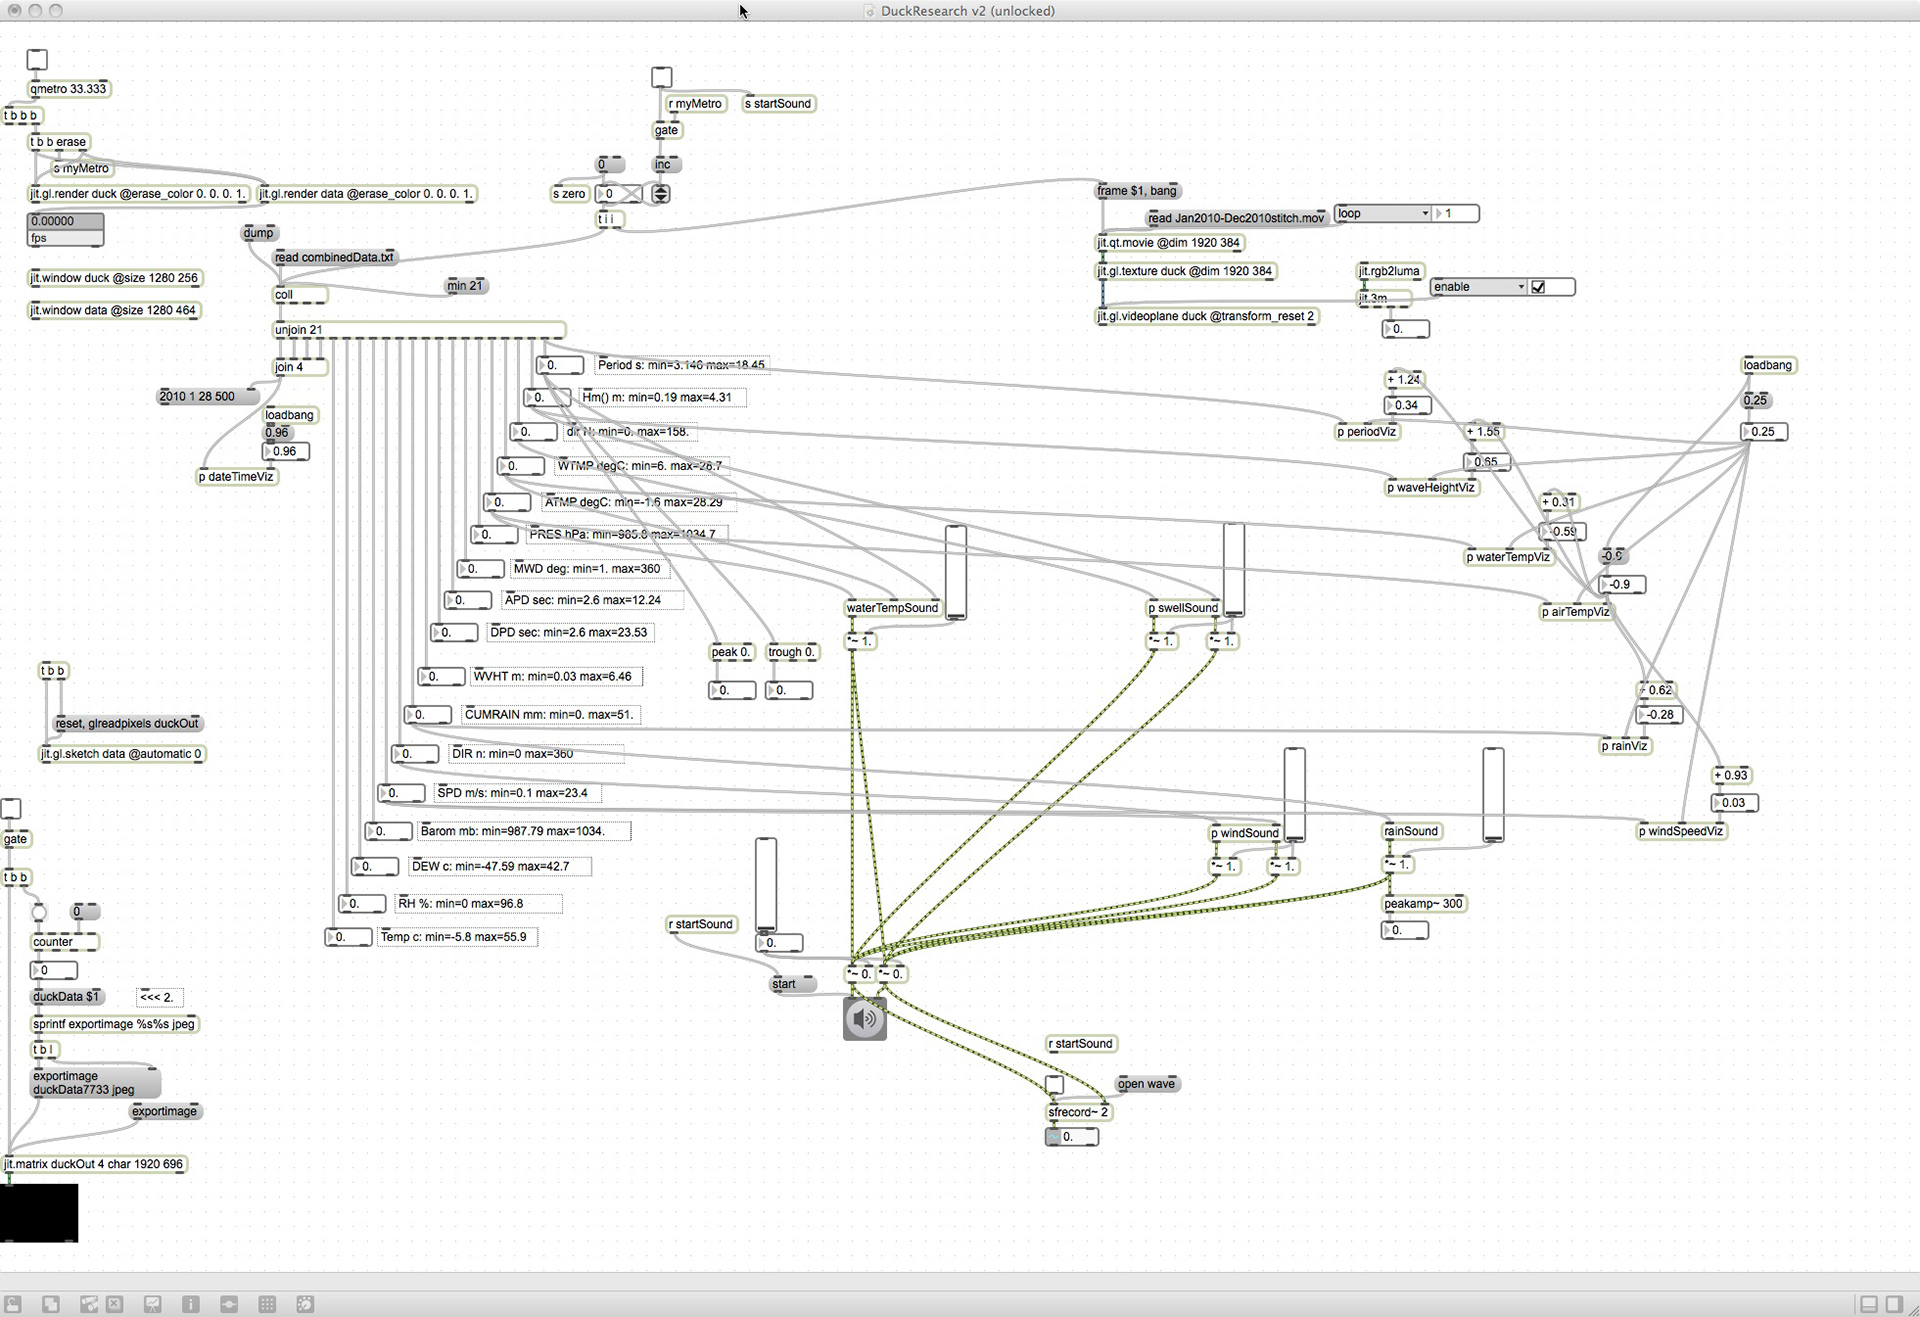
fig.5 Main Max patch for driving audio and visuals.